

Hello, traders.
I’ve spent years (and still pending) looking for a “low-risk” entry that capitalizes on a simple truth of the market, institutional order flow matters.
A trading technique that captures this edge is one I found inspired by the teachings of Brian Shannon, a well-known technical analyst and pioneer of using the Volume Weighted Average Price (VWAP).

The concept is simple. The price near the VWAP is a magnetic area of high trading volume and institutional activity. Large money managers use the VWAP as a benchmark to execute huge orders without moving the market too much. When price comes back to this level, it’s coming back to where a lot of capital was recently traded, and this makes it a natural point of support or resistance.
The question then becomes…
How do we know if the VWAP will hold, or if the pullback is a fake-out?
The Strategy Overview
The strategy I tested combines the institutional anchor of the VWAP with a fast-acting Relative Strength Index (RSI) to find deep, temporary price movements that are likely to snap back towards the VWAP and then continue the current trend.
Here’s the core logic:
We use the VWAP as our line in the sand; the price must be above it for long trades and below it for short trades.
We only enter when the price comes very close to the VWAP, which shows a strong attraction back to the average trading price for the session.
To filter for a strong, temporary pullback, we use a short-length RSI, specifically, RSI(2). When the price is above the VWAP but the RSI(2) is extremely oversold (below 30), it suggests the small counter-trend move is overdone and a bounce is due. This helps us avoid “catching a falling knife.”
This approach is about buying low in an uptrend and selling high in a downtrend, right at the point where the institutions are most likely to be trading.
Why This Works
Brian Shannon teaches that the Anchored VWAP (AVWAP) represents the “absolute truth of the relationship between a stock’s supply and demand” because it combines the three most important components: Price, Time, and Volume.
The VWAP’s power comes from volume. The price near the VWAP acts like a strong center of gravity because the most shares exchanged hands around that level. When a stock price moves away from VWAP, it is considered a departure from “fair value” for the day. Institutional traders love this indicator because it allows them to prove that they executed their large orders at or better than the market’s average price for the day.
When we see the price briefly undercut the VWAP and a short-term momentum indicator like RSI(2) screams “oversold” inside a bullish trend, we are catching the final flush of retail sellers before the big money steps back in to defend their average entry price.
Backtest Setup and Results
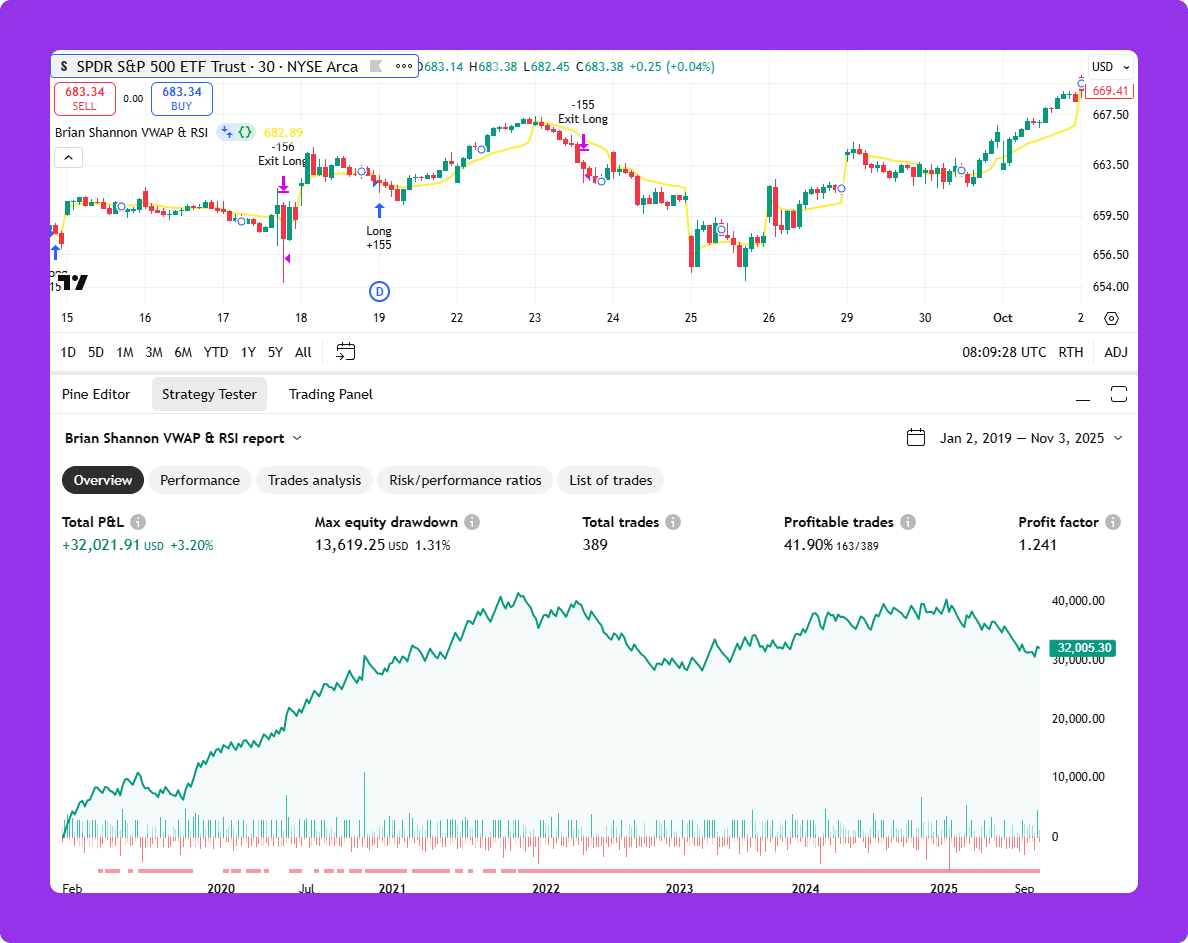
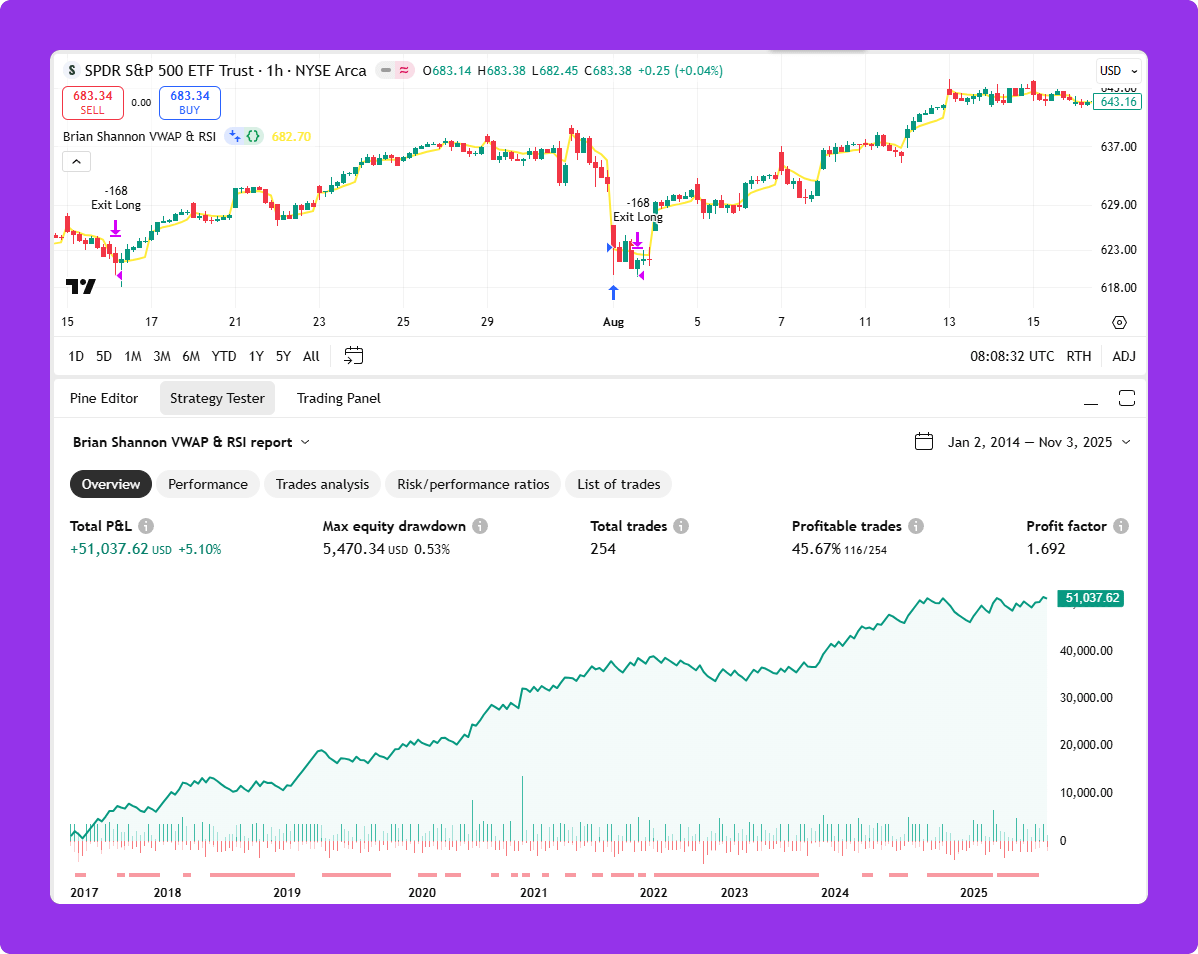
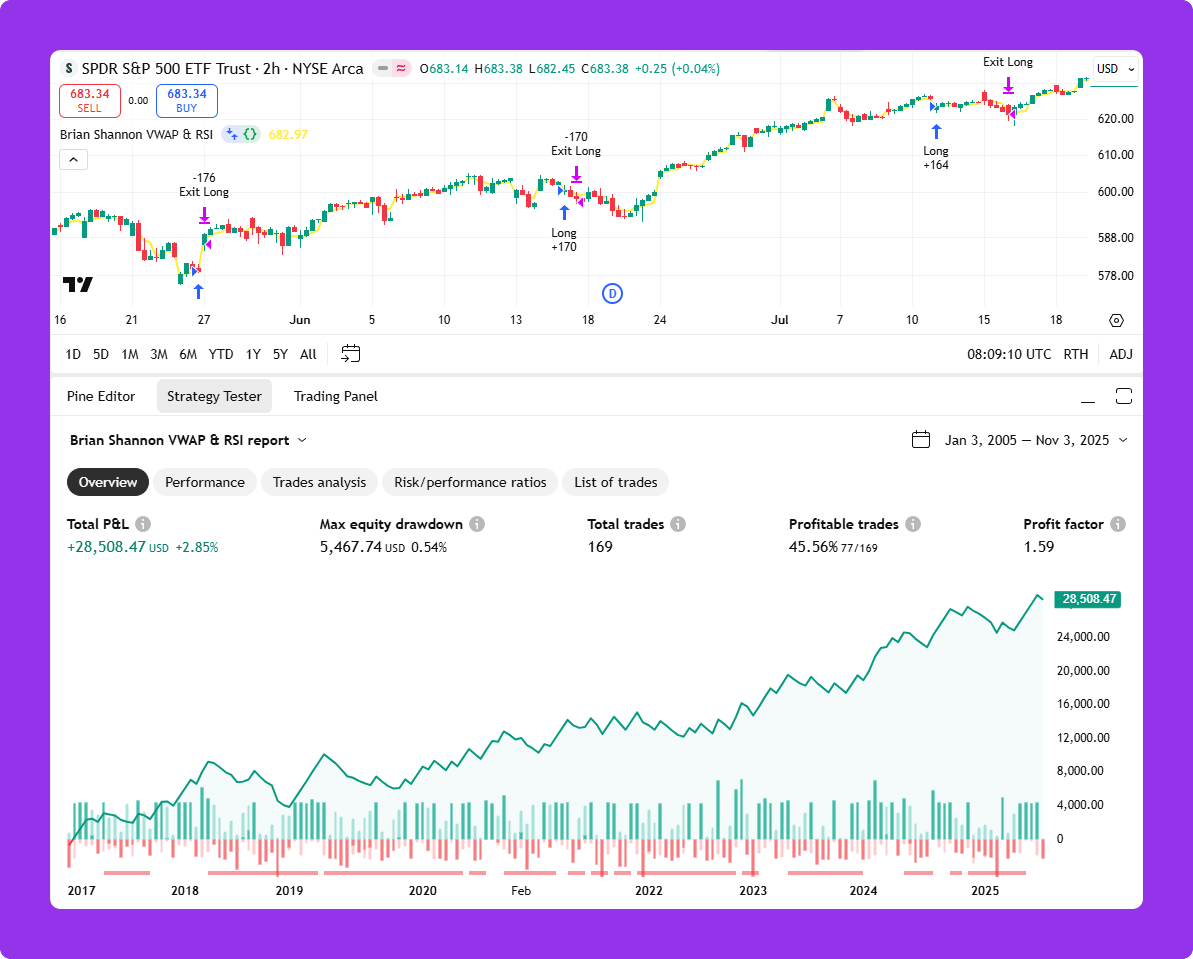
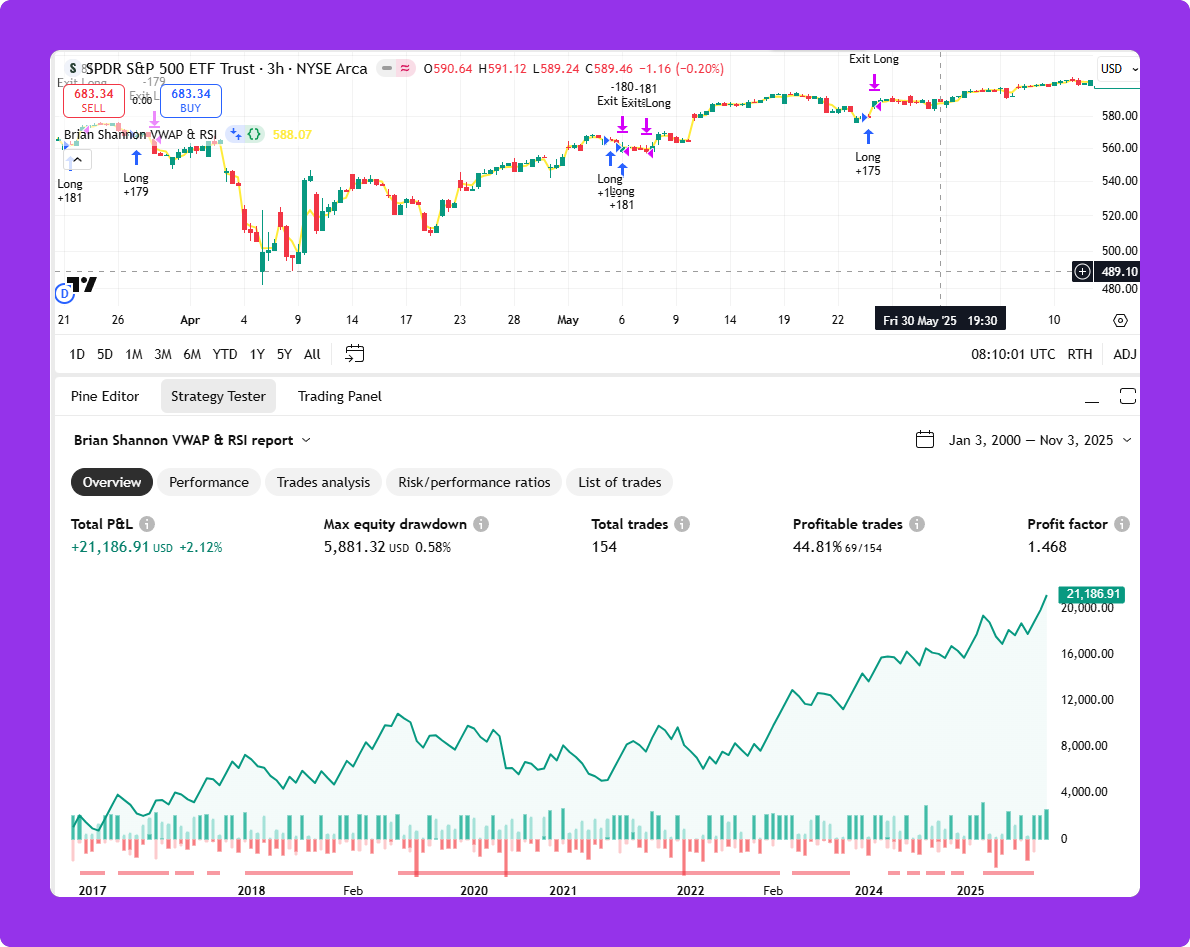
To ensure this strategy was strong and not a one-time fluke on a single chart, I tested it across multiple timeframes, including the:
15-minute

30-minute
1-hour
2-hour
and 3-hour charts.
I mainly used the 1-hour timeframe, which is often favored in Brian Shannon’s multi-timeframe analysis approach.
The goal of testing multiple timeframes was to prove the logic holds regardless of the chart setting, making the signal reliable.
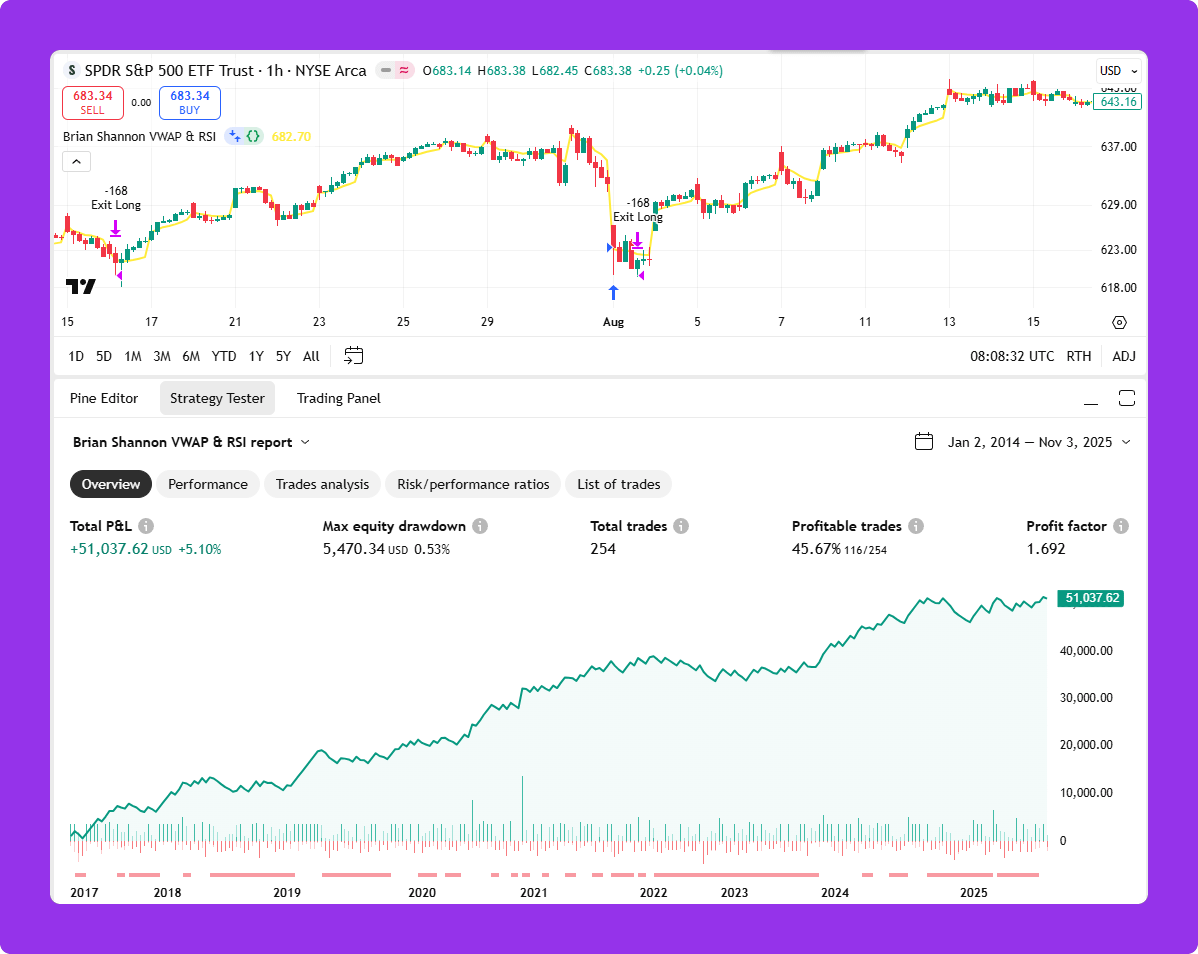
The backtest results below use the 1-hour timeframe on the SPY ETF (the S&P 500 tracking fund) from January 2017 to November 2025.
Metric Result
Total P&L:+5.10%
Max Drawdown: 0.53%
Total Trades: 254
Profitable Trades: 45.67%
Profit Factor: 1.692
Instrument/Timeframe: SPY, 1-hour
The win rate is under 50%, which is completely fine, because the Profit Factor is 1.692, which is considered very strong. A high Profit Factor means that the winning trades are much larger than the losing trades. This shows a positive expectation, which is the most important component of any strategy.
Takeaways & Next Steps
This simple combination of VWAP and RSI(2) provides a low-risk, high-probability entry for trading pullbacks. The key is in the timing and staying close to the price where big players operate.
To make this strategy even better, here are a few steps you can take:
Add a Trend Filter: Brian Shannon often uses the 5-day Simple Moving Average (SMA) as a powerful short-term trend filter. You should only take long signals if the price is above the 5-day SMA, and short signals if the price is below it.
Manual Market Sentiment Check: Before taking a trade, check the overall market sentiment. If you get a long signal but the overall market (like the S&P 500) is clearly in a deep, aggressive sell-off, you should skip the signal. Only take trades that align with the higher-timeframe market flow.
Multiple Timeframe Confirmation: Before entering on a 1-hour chart, check the 4-hour or Daily chart to ensure the trade is in the direction of the dominant trend, as taught in Brian Shannon’s work on multiple timeframes.
Full Rules + TradingView (Pinescript) Code
✅ Subscribe and get all the rules forever.